Section 1.2 — Statistical Studies: Observation and Experimentation
Although we won’t be seeing math in this chapter, all of the key concepts in this section and chapter are extremely important for the rest of the course. Throughout this course, we will be primarily looking at two different study methodologies: Observational and Experimental Studies.
An Observational Study is a data collection methodology where the data is gathered for the purpose of quantifying a characteristic about a group of interest. The collection method is done by observing the specific characteristic as it exists in the group.
An Experimental Study is a data collection methodology where the data is gathered for the purpose of quantifying a change in a characteristic under a variety of conditions. The collection method is done by a researcher evaluating how the characteristic changes under researcher-imposed conditions.
Before we go into examples of Observational and Experimental Studies, we first need to expand on a key component for both of these study types: what is a group?
A population is every single individual in some collection or group you are studying.
A sample is a nonempty subsection of the population.
A sample cannot be the entire population; we instead call the selection a census.
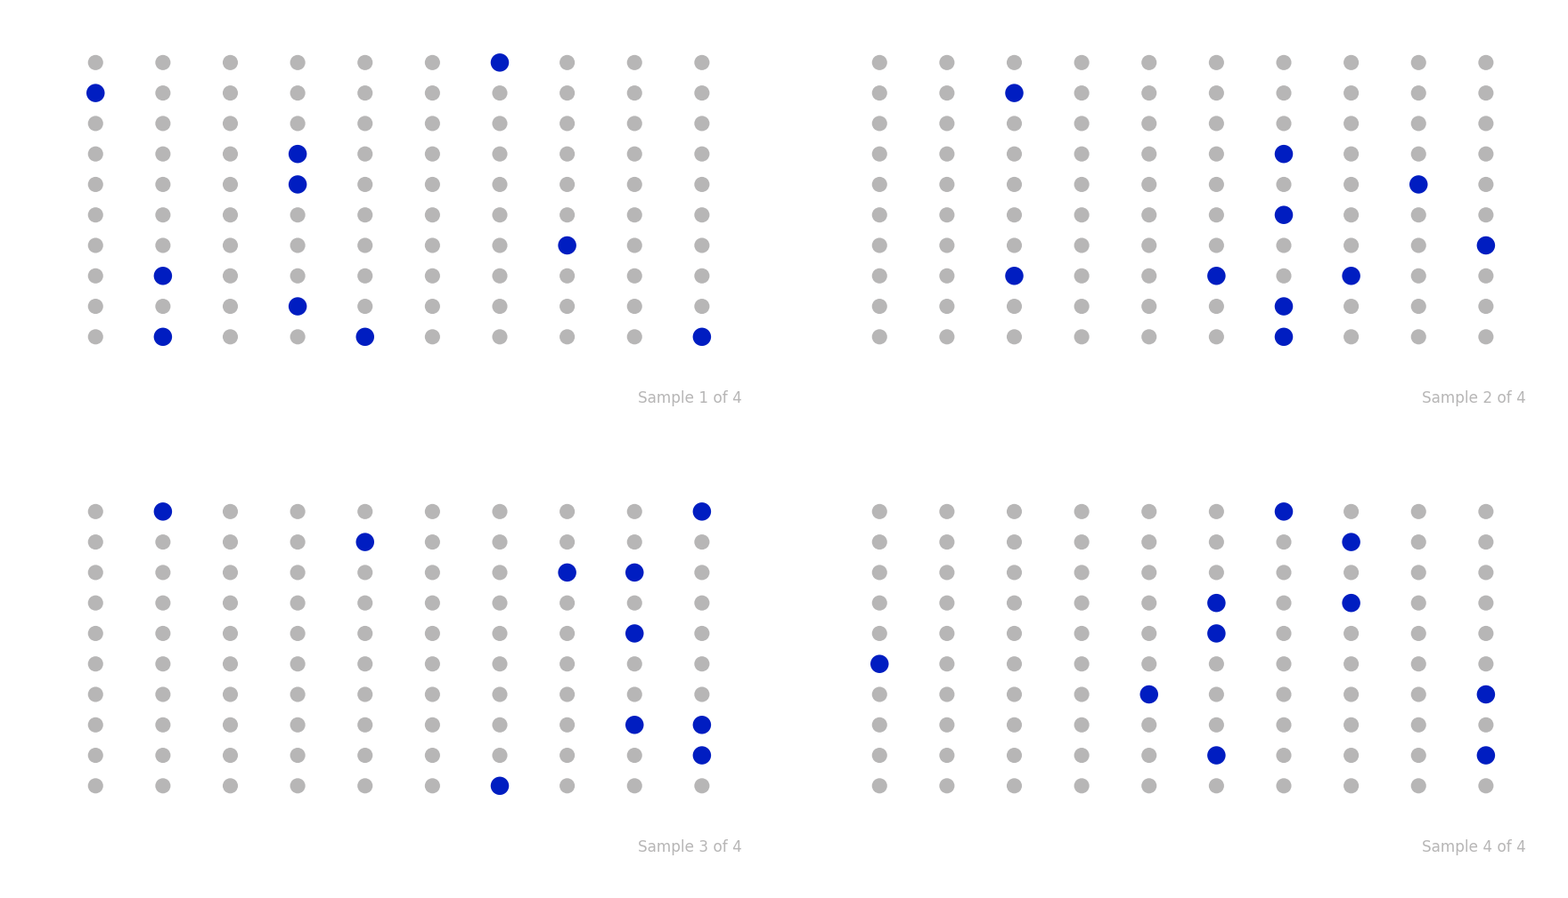
It may help to look at an example of a sample from a population. Assume we are looking at a school of 100 students at a school (our population), and we are selecting 10 students at random to be included in the sample. The blue dots were selected, while the gray students were not. The figure alternates between 4 different samples.
After introducing all these important course-wide terms, let’s look at some examples. These are all fake studies; some of them are more applicable to what you will be seeing in the real world and others are intended to be more engaging.
Example: The Clown Name Study
Breaking News: Harvard researchers conducted a cutting-edge study on Californian clowns. They sent out a survey to the students at the Clown Create program at Dell’Arte International. The researchers polled 100 clowns on their names and found that 72% of the clowns were named Bozo.
Analysis: Obviously this is a fake study, but let’s break it down. First, this is an Observational Study, and the variable (we will see this term later) we are observing is the clowns’ names. There are no researcher-imposed conditions to evaluate a changing characteristic—for example, the best whipped cream for a pie in the face, the best banana brand to slip on, or the funniest clown nose. The population of interest is Californian clowns, and the sample is the 100 clowns polled in the Dell’Arte International Clown Create program. This selection would not be a census, since there are clowns in California who are not currently in that program.
In the other sections of this chapter, we will expand on our analysis as we learn more key ideas. Now, let’s look at a modification to this study that makes it an Experimental Study.
Example: The Best Clown Nose
In order to find the best clown-nose color for Californian clowns, the 100 clowns from the above study were split into 4 groups of 25 clowns. The first group had no clown nose, the second group had a red clown nose, the third group had a blue clown nose, and the fourth group had a purple clown nose. Each clown did the same performance in front of the same group of people. When the group laughed, the laughter’s volume was recorded in decibels. The red clown-nose group was found to have the highest average volume.
Analysis: This study clearly has researcher-imposed conditions, namely the clown-nose color; hence, this is an Experimental Study. Initially, you may be thinking that the clown noses may be included in the population and sample, but these are the researcher-imposed conditions we are testing. The population would be Californian clowns, and the sample would be the 100 clowns. In Section 1.4, we will be learning how to break down this experiment even further, including the group with no clown nose. In Section 1.5, we will analyze the importance of randomness in this study, especially since the same audience viewed all 100 performances.
Example: New Grill
You are working at an outdoor kitchen company that has recently created a new grill design for the BBQ 1000. Their goal is to improve grill times by 10% or more compared to the previous grill model on the BBQ 1000. To test this, you take 25 BBQ 1000s with the new grill design and 25 with the old grill design; to measure the cook times, you take 50 raw 100% beef patties and cook one on each BBQ 1000. After gathering all the data, you find that the average for the new grill is actually 35% quicker than the old design.
Analysis: This study clearly has researcher-imposed conditions, namely the grill type; hence, this is an Experimental Study. Similar to the Best Clown Nose Study, the population and sample are not the treatments. The population would be BBQ 1000s, and the sample would be the 50 BBQ 1000s. There is an additional detail in this example that makes it unique: the meat you are testing is held consistent across all tests, again covered in Section 1.4. Another component of this example I want to highlight is an unexpectedly high improvement; in later chapters, we will quantify when a sample causes us to reject or fail to reject our initial hypothesis. In our case, does the 35% improvement in our sample support our claim that our grill is at least 10% faster? For now, I will leave it to you to think about.