Section 1.3 — Collecting Data: Planning an Observational Study
In this section we will focus on how to plan a well-designed Observational Study, including creating a representative sample and avoiding bias. After grounding these terms, we will go through and evaluate a few Observational Studies.
Randomness
In the clown name example there was no information on how the students in the poll were selected. Did the researchers break up the clowns into groups, with Dell’Arte International the only group selected? Was the poll sent out to all students at the school? Both of these questions are immensely important for a study’s accuracy. However, we will start with the central question: How do we randomly select something? This naturally leads us into our simple random sampling strategy; when we explore randomness in a more methodological sense, we come up with three additional strategies: 1-in-k systematic sampling, stratified random sampling, and cluster sampling. Before we go into more detail on random sampling strategies, let’s return to answer our central question.
How do we randomly select something?
One of the easiest ways to understand a random sample is a bag of marbles. Imagine that your population is represented as a huge bag of marbles. You can then blindly reach into the marble bag and pick out one of the marbles; record which marble was chosen to include it in the sample; repeat this process n times to get a sample of size n. This process was done randomly—you had an equal chance of selecting any of the marbles. Although our quick example was with marbles, you can do this with dice, coins, random number generators, and more. However, you may be noticing a potential problem with our example: what do you do with the marble you are currently holding? Do you set it aside? Do you place it back in the bag? These are both possible options: one is sampling without replacement, while the other is with replacement. Before we go into more detail, let’s look at some formal definitions.
A simple random sample of size n is a sampling strategy where the researcher selects the individuals from the population for the sample such that there is an equal chance they are selected for the size n sample. Throughout this course we will be assuming this procedure is without replacement, unless stated otherwise.
To sample with replacement is to put the individual back into the possible selection population after you have selected and recorded it into the sample. Hence, a single individual can appear in the sample multiple times.
To sample without replacement is to not put the individual back into the possible selection population after you have selected and recorded it into the sample. Hence, a single individual can appear in the sample at most one time.
Again, all these definitions can be dense at first, but seeing an example will help. We will first look at an example of a simple random sample of size 5 with replacement.
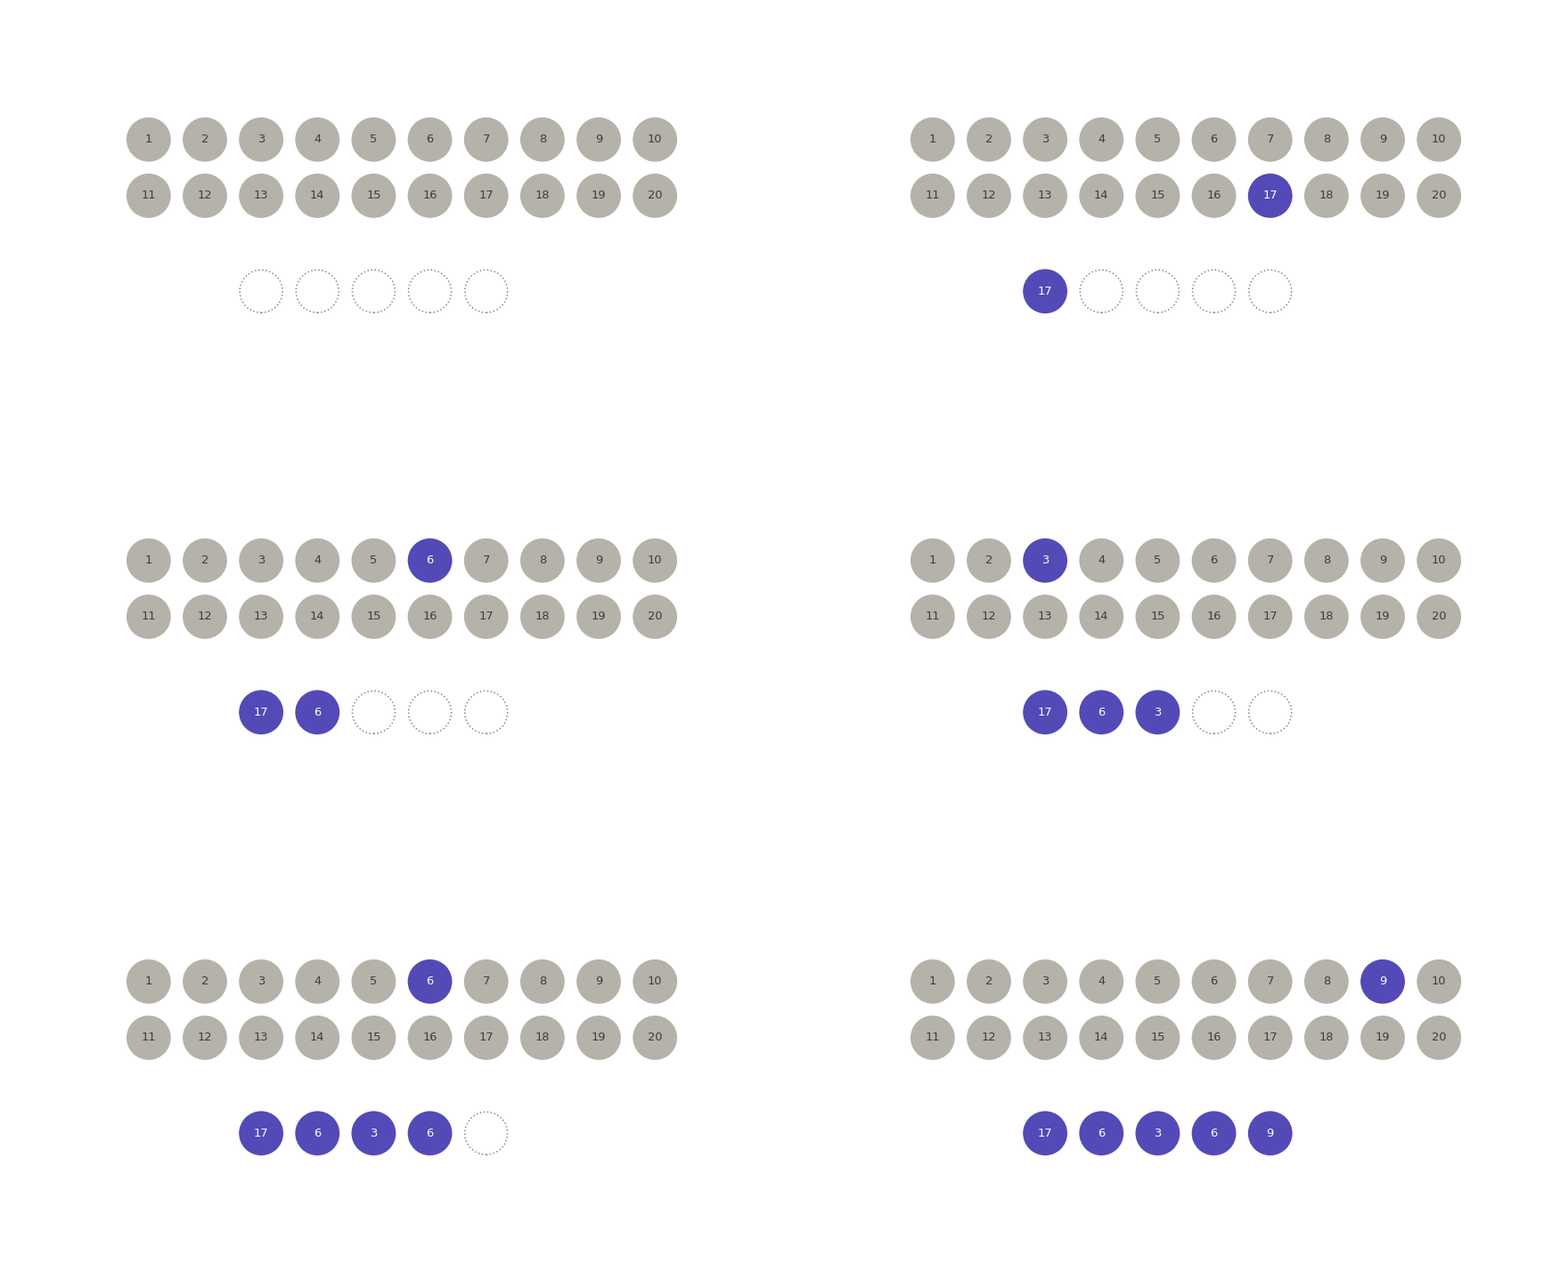
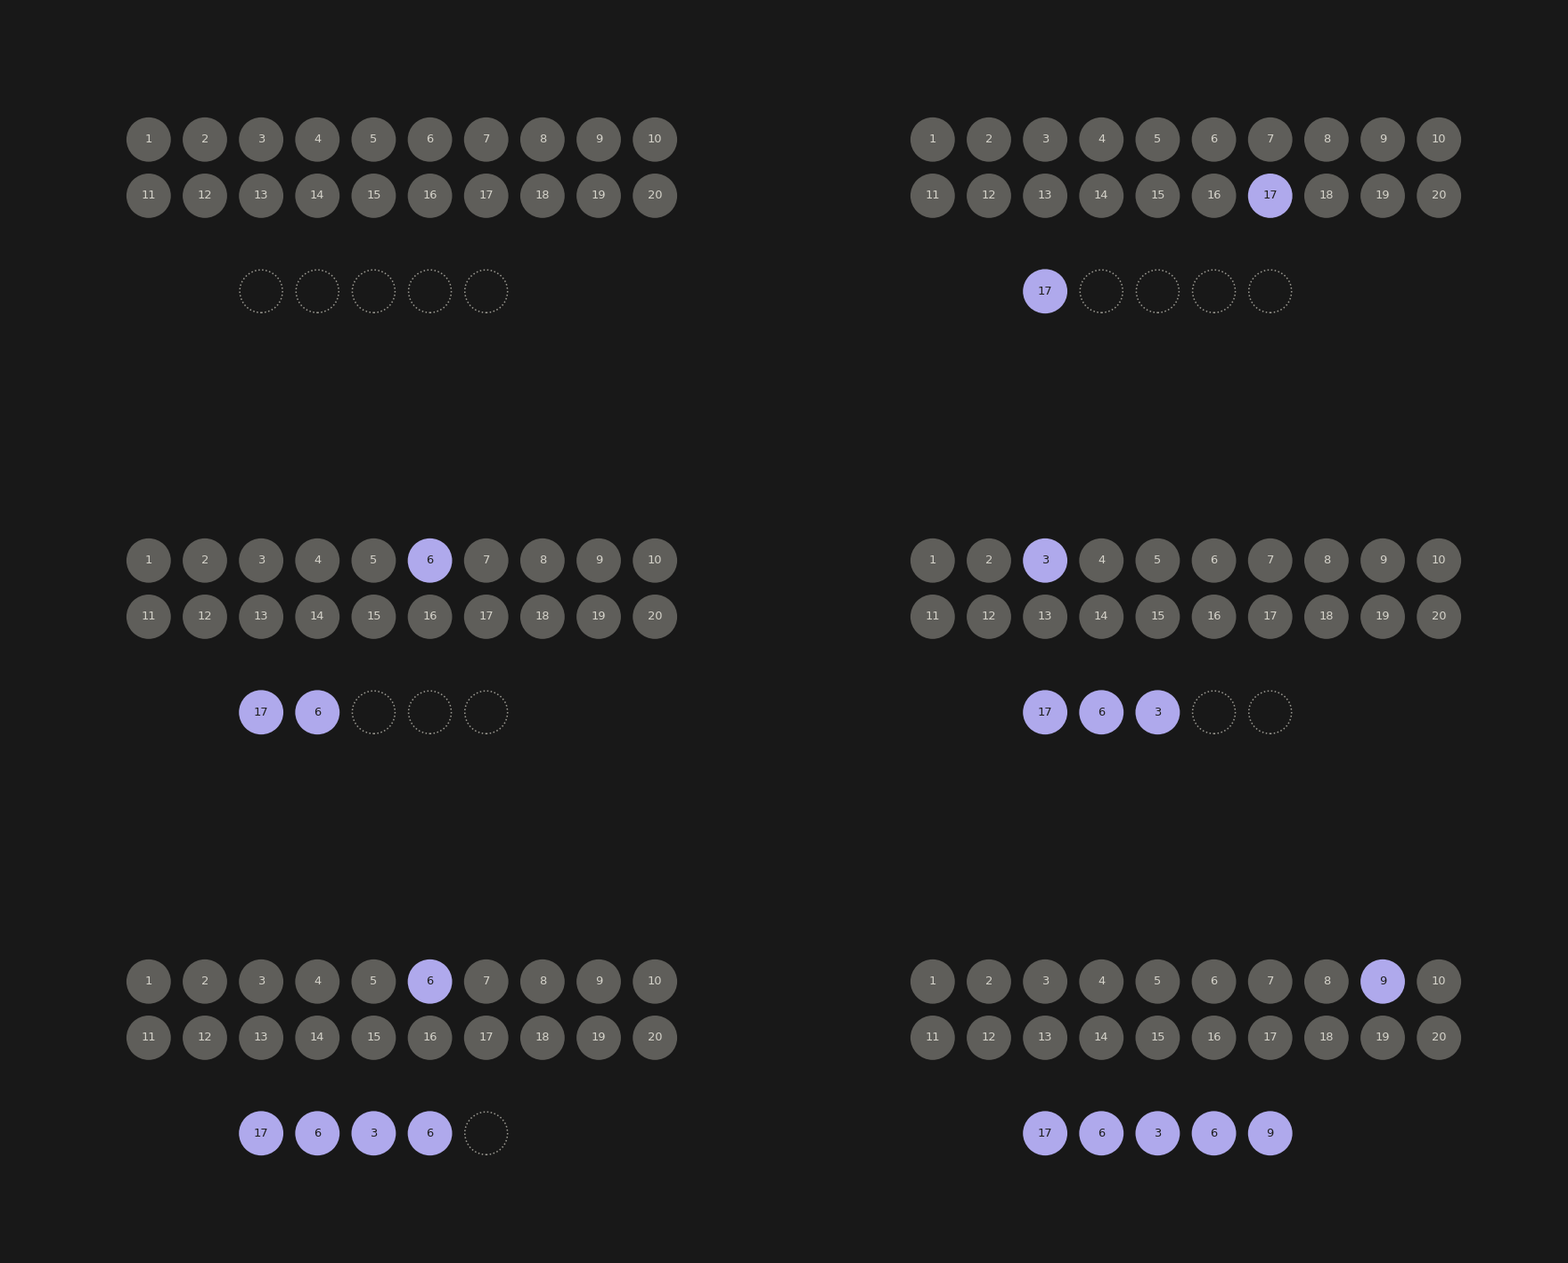
There are 20 individuals in the population and we are choosing a sample of size 5. The lit-up circle represents the random individual selected to be included in the sample, and this is recorded in the bottom row. So, 17, 6, 3, 6, 9 is the entire random sample. Notice that we ended up recording 6 twice; this is the with replacement element of our sampling strategy. The key component for identifying a with-replacement sample is every chosen individual being returned to the population that is being actively sampled. We do not set aside any individuals; every individual appearing in the sample can be chosen again.
Now, we will see the exact same population undergoing a simple random sample of size 5. Notice I did not include the without replacement specification—this is because it is unneeded given our course-wide assumptions.
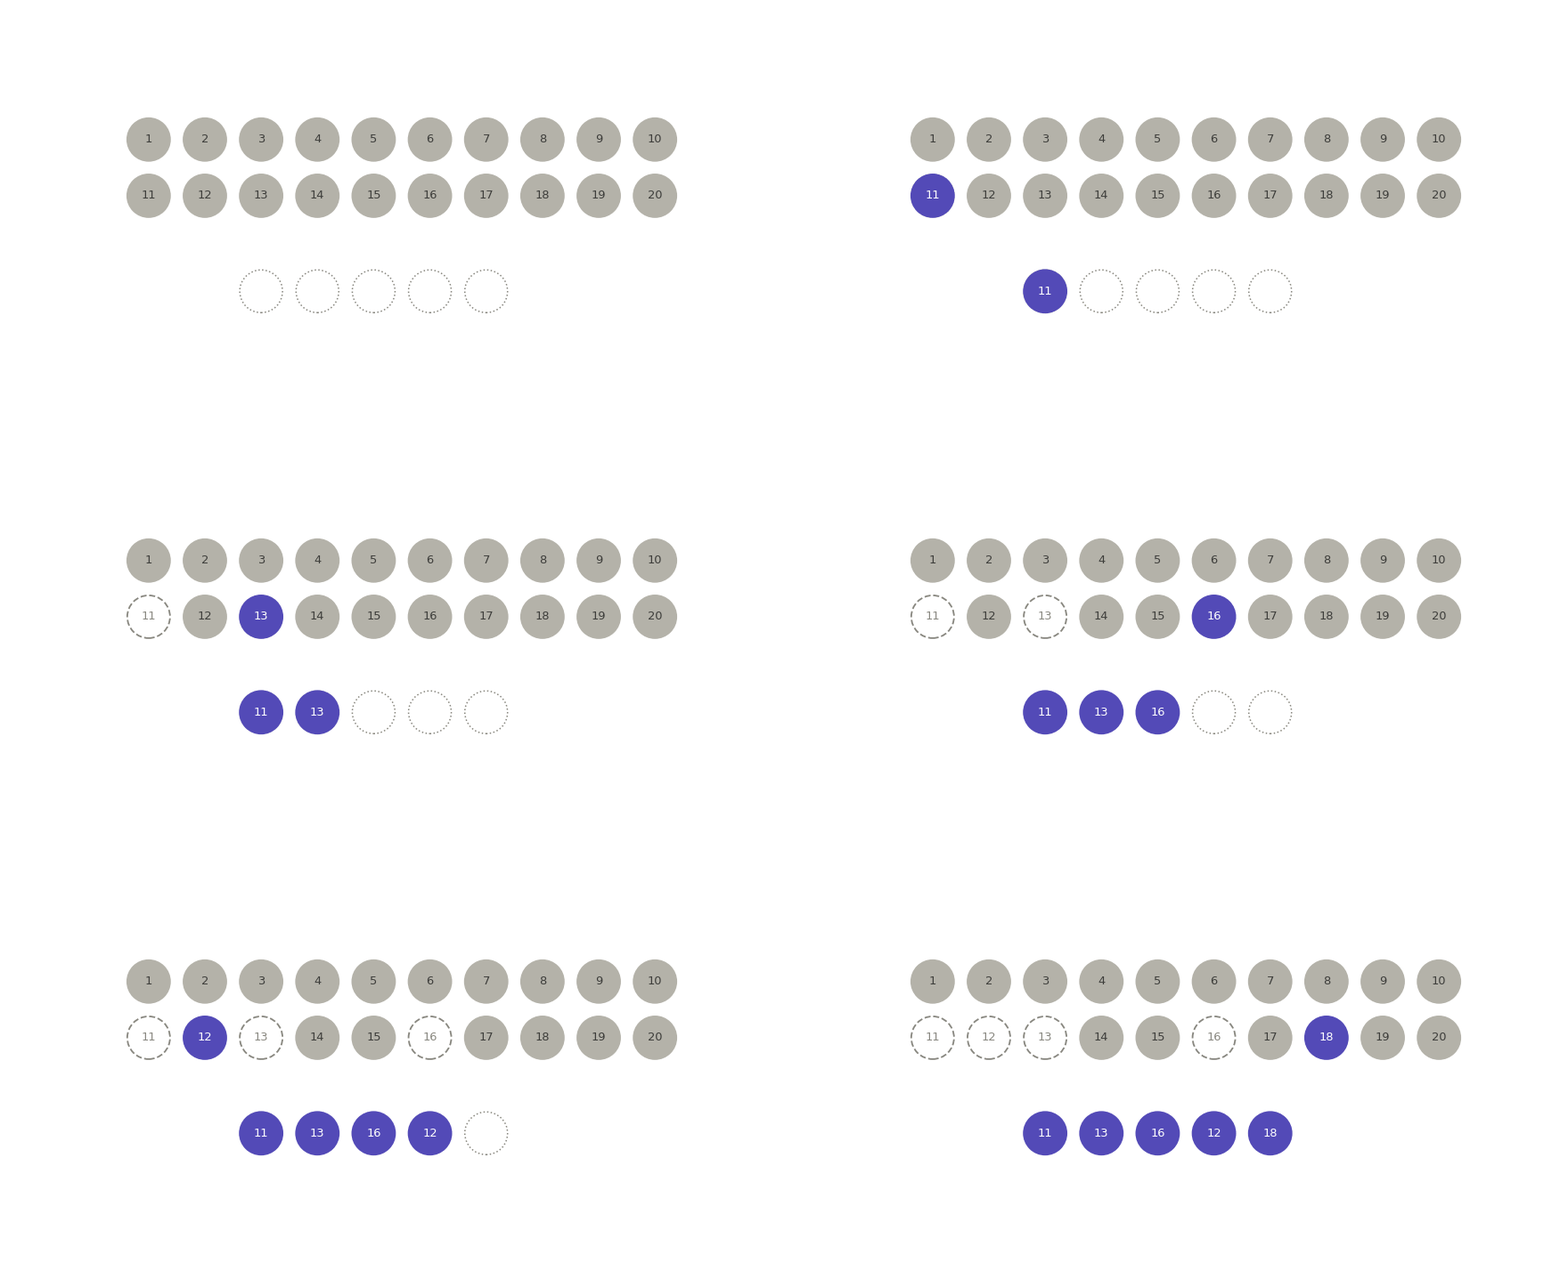
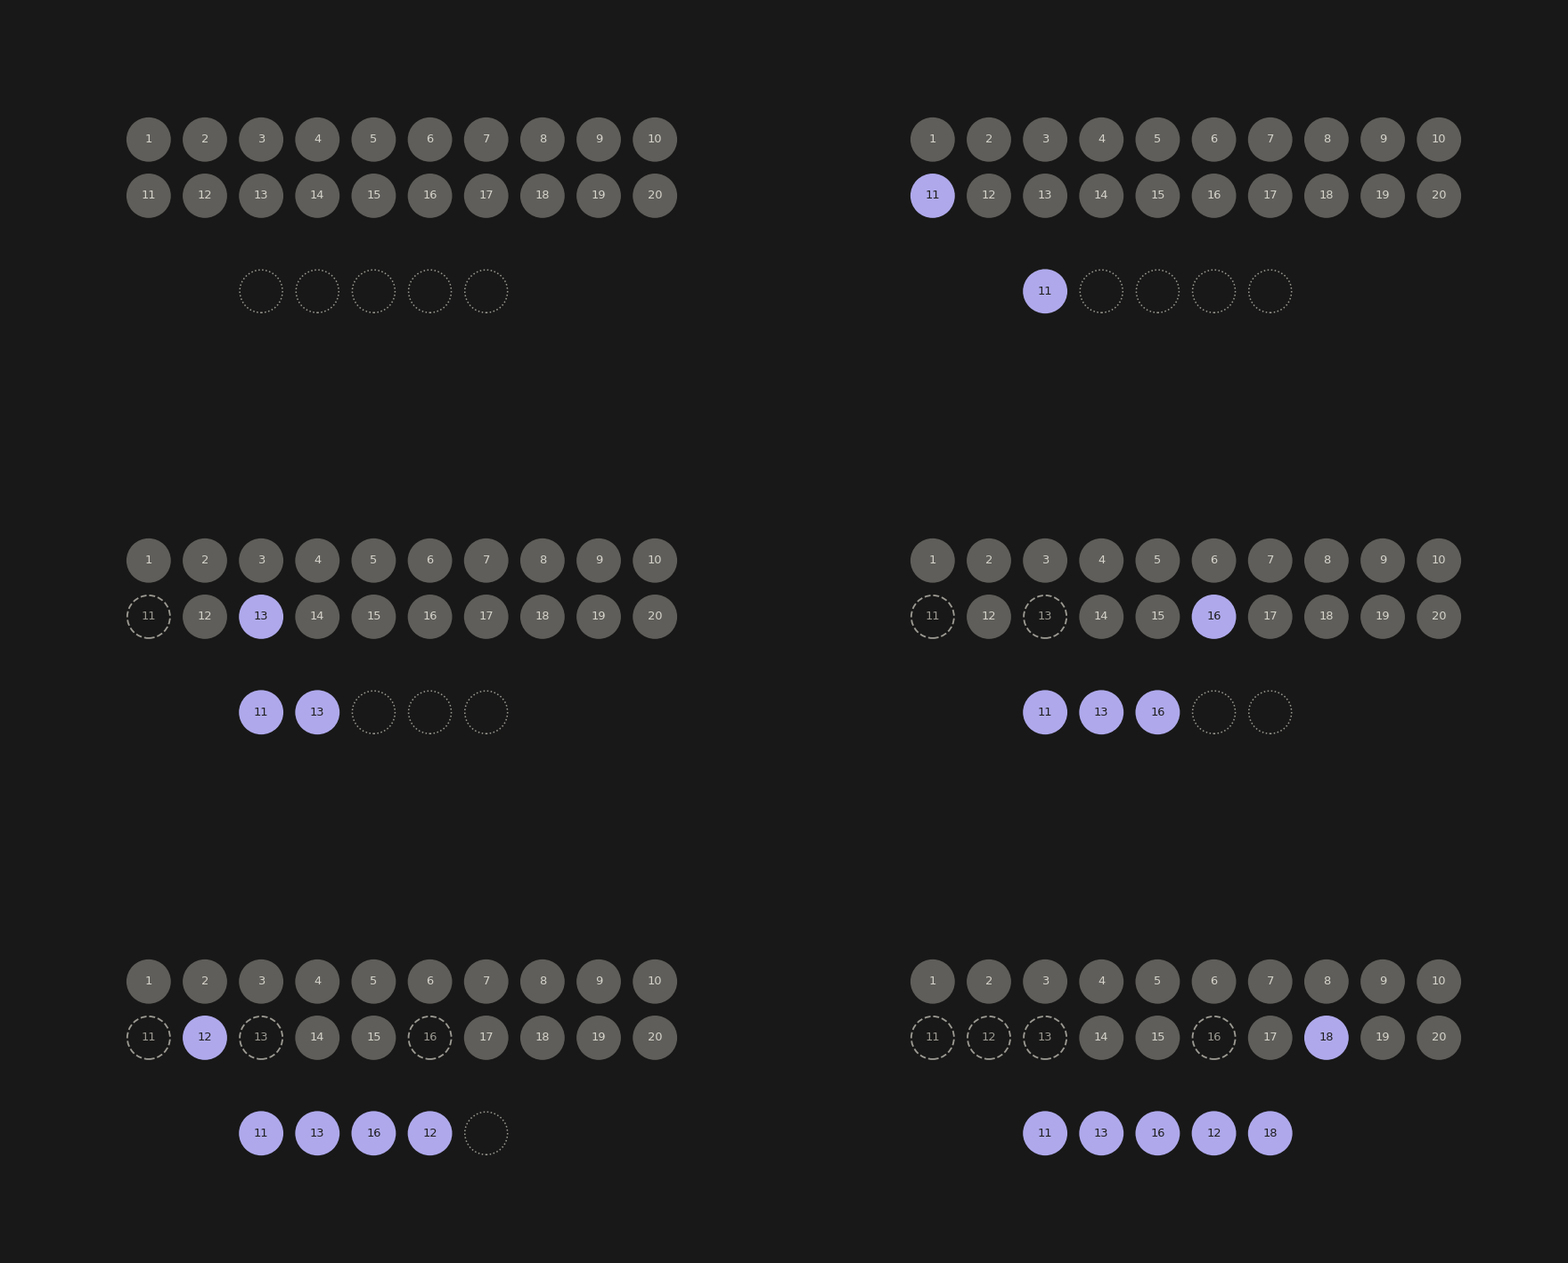
Again, there are 20 individuals in the population and we are choosing a sample of size 5. However, after a circle lights up, the individual is removed from the actively sampled population; to represent the missing individual, a dashed outline is used. Let’s do a simple calculation of the likelihood for choosing a specific circle. The first individual selected for the sample is 11, which has a likelihood of \(\frac{1}{20}\). The second individual, 13, does not have the same \(\frac{1}{20}\) chance of being chosen—like it did in the with replacement sample—it has a \(\frac{1}{19}\) chance. After removing 11, there are only 19 remaining individuals in the actively sampled population. We can continue this logic to find that 16 has a \(\frac{1}{18}\) chance, 12 has a \(\frac{1}{17}\) chance, and 18 has a \(\frac{1}{16}\) chance. Notice that each event changes the likelihood of selecting an individual. This is the central characteristic of without replacement sampling: the prior event affects the probability of choosing an individual.
Since the probability of selecting an individual for each event changes, you might think that this violates the equally likely condition in the definition. The key takeaway is that each individual is equally likely to appear in the sample, not that each individual has an equally likely chance of being selected in every single event. This is an example of conditional probability, which we will learn more about in Chapter 4.
0.0.1 FINISH UP TALKING ABOUT THIS SECTION